Analysis
Analysis
Analyses Done
Delineating the shortest path (catchment area) from each TEL train station, based on a walking speed of 4.4 km/h.
Calculating the number of residents living in each catchment area of each TEL train station.
Calculating the number of bus stops in each catchment area of each TEL train station.
TE23 Tanjong Rhu Station
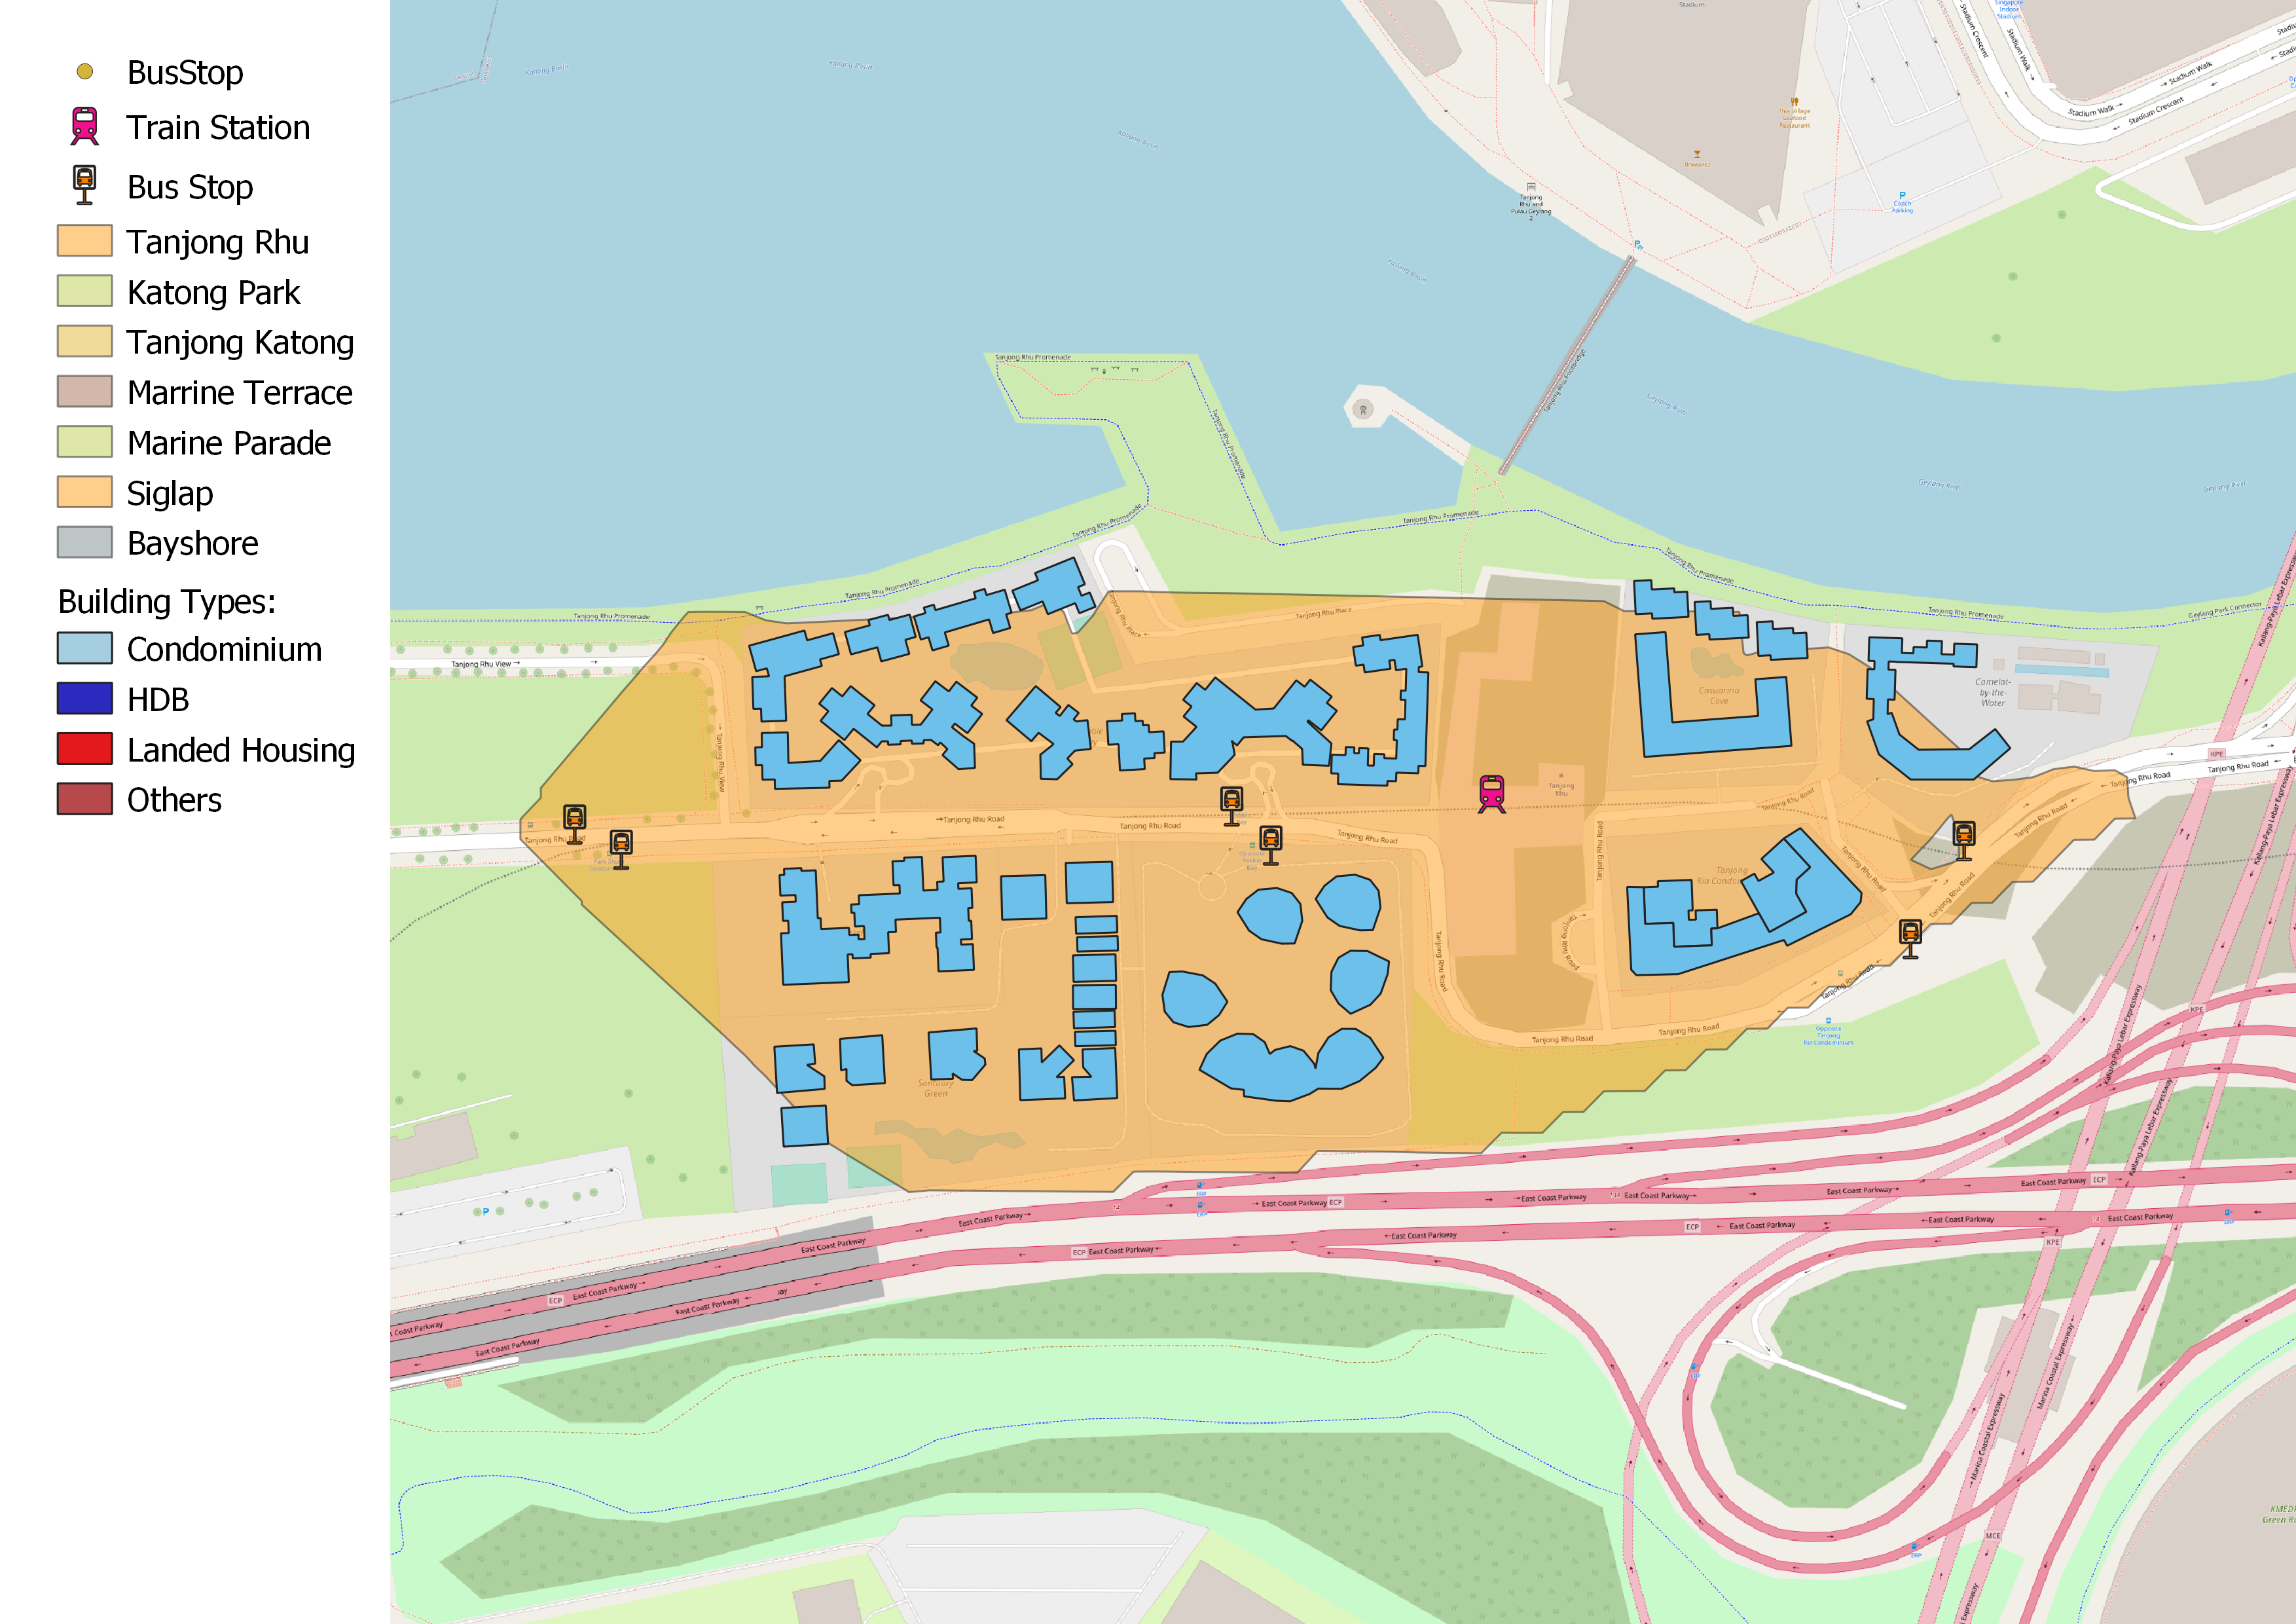
Based on our analysis, we can observe there are not many residential buildings located near TE23. All of the residential buildings located in the catchment area are condominiums.
Furthermore, this train station is situated between a river and expressway, which reduces the potential catchment area of the train station.
TE24 Katong Park Station
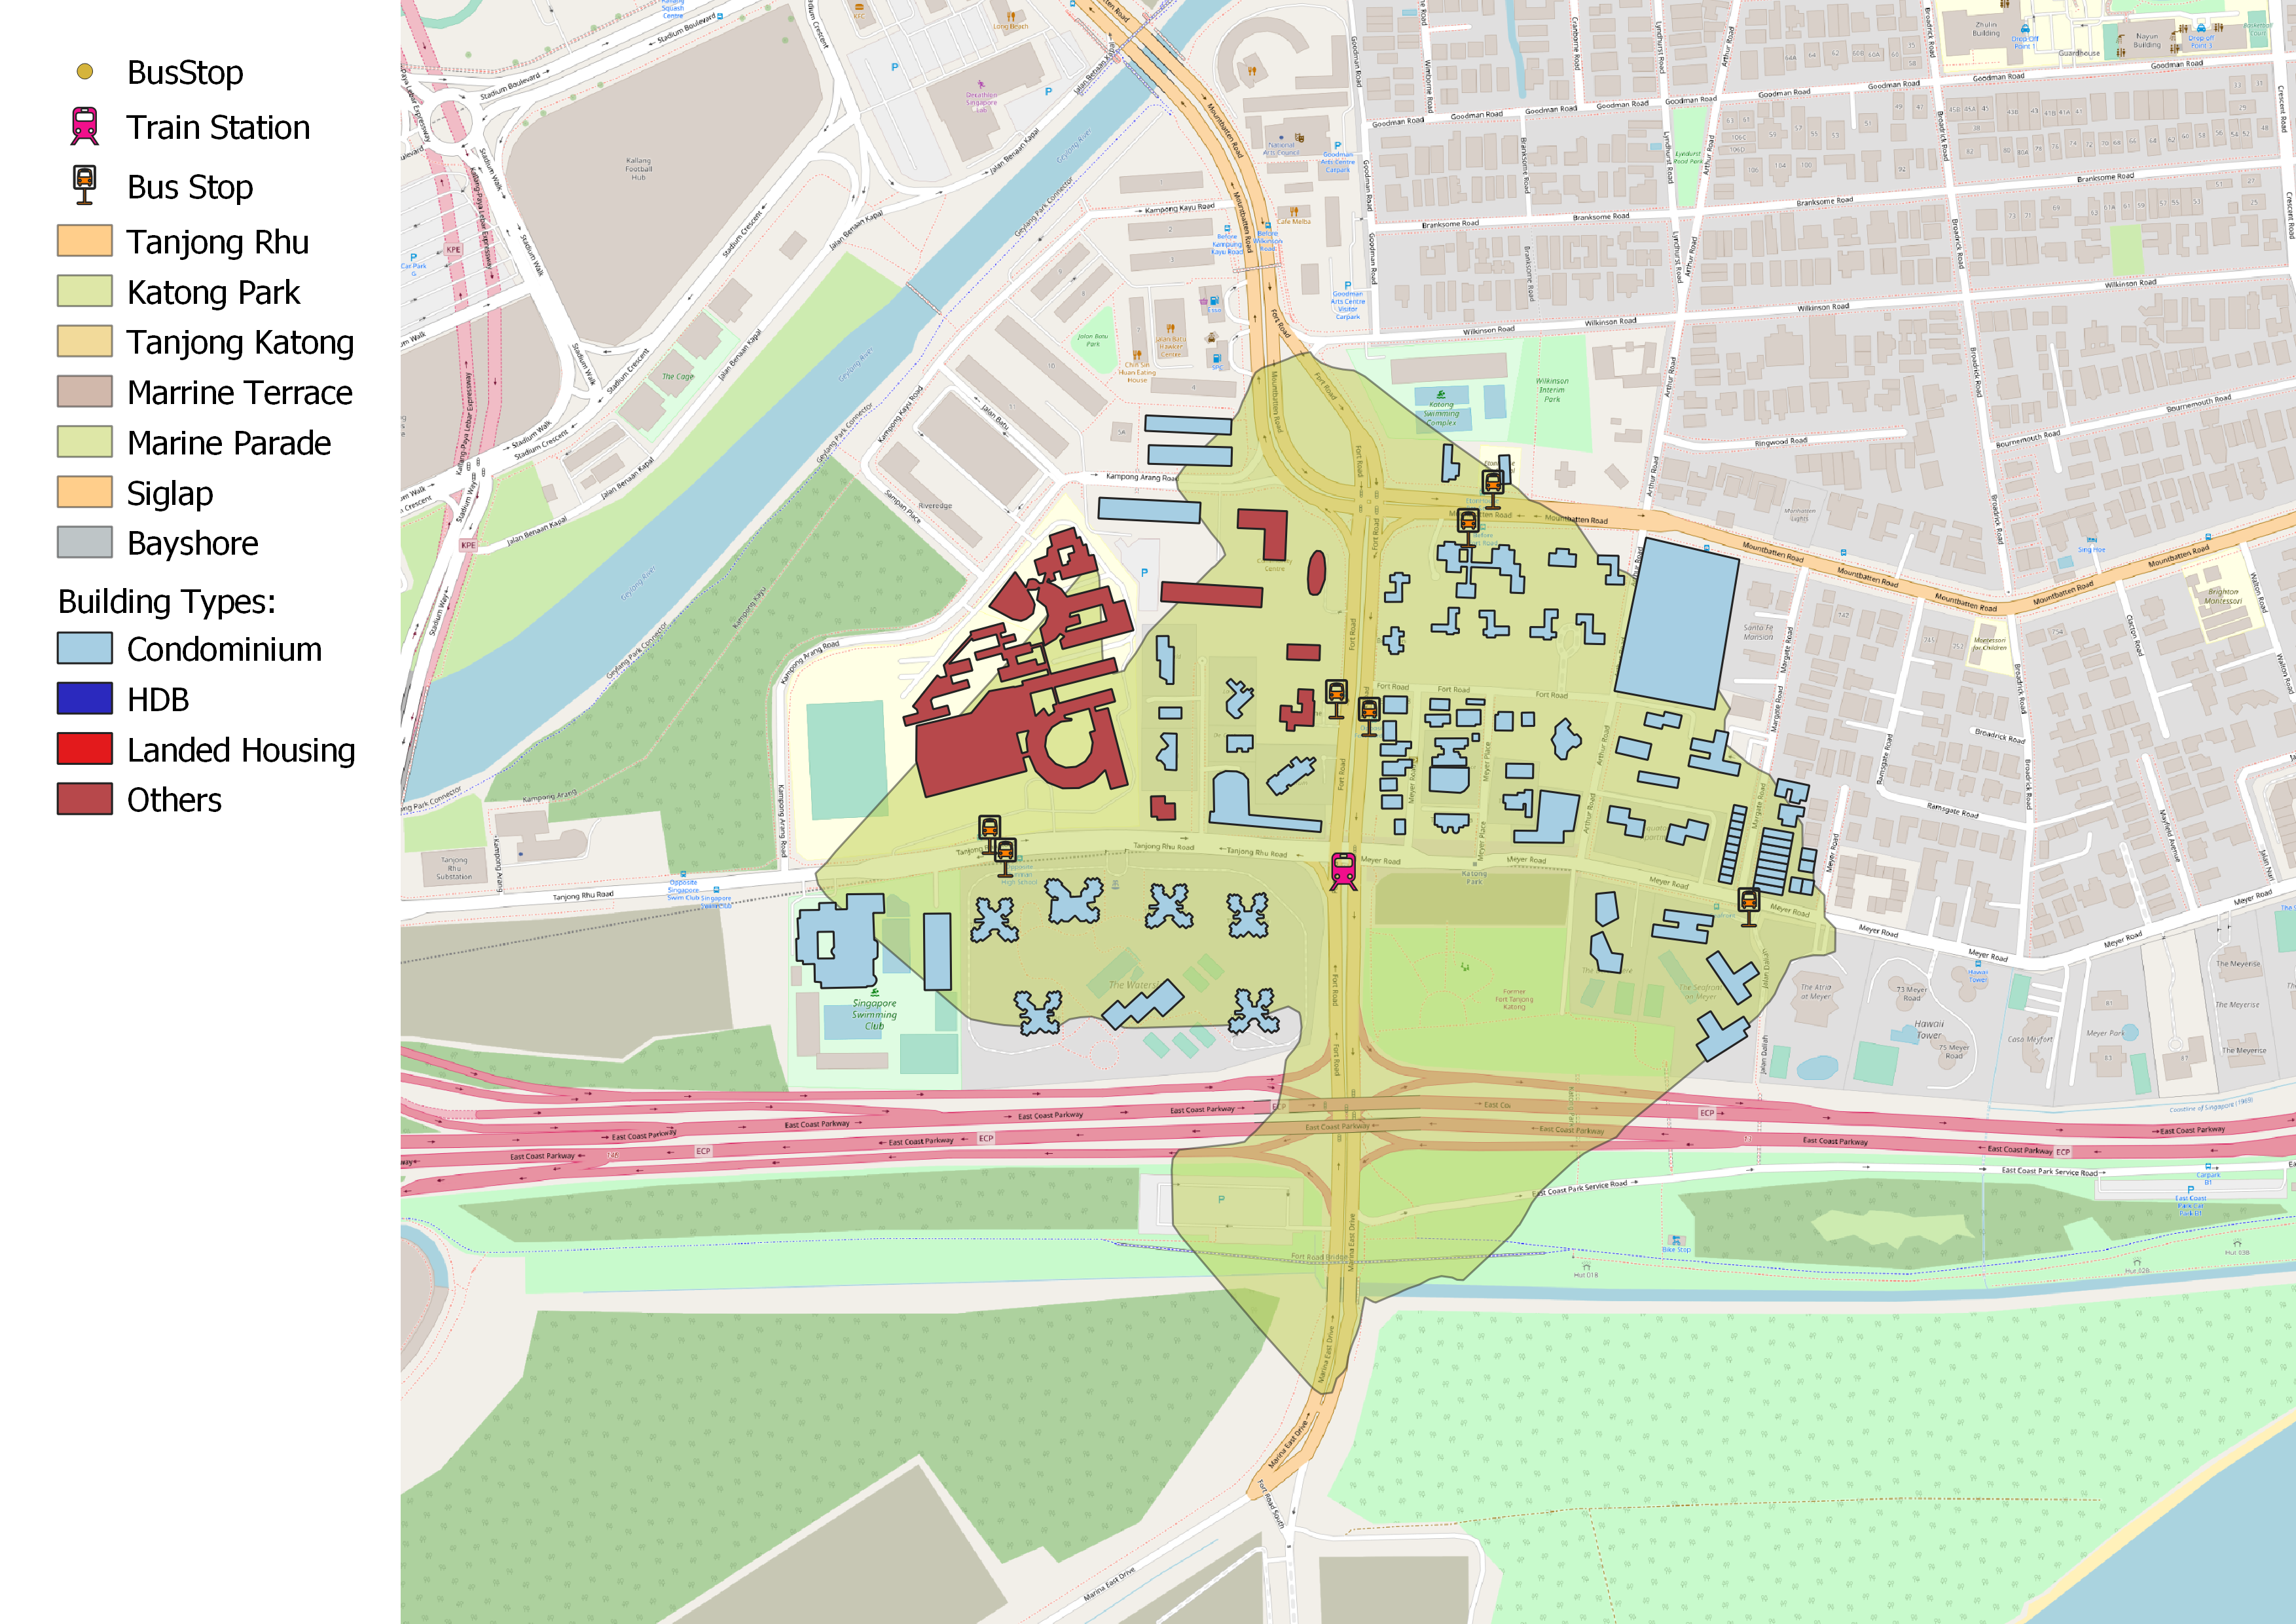
Based on our analysis, we can observe that most of the residential buildings located in this catchment area are HDBs, and that this catchment area is relatively sparse.
TE25 Tanjong Katong Station
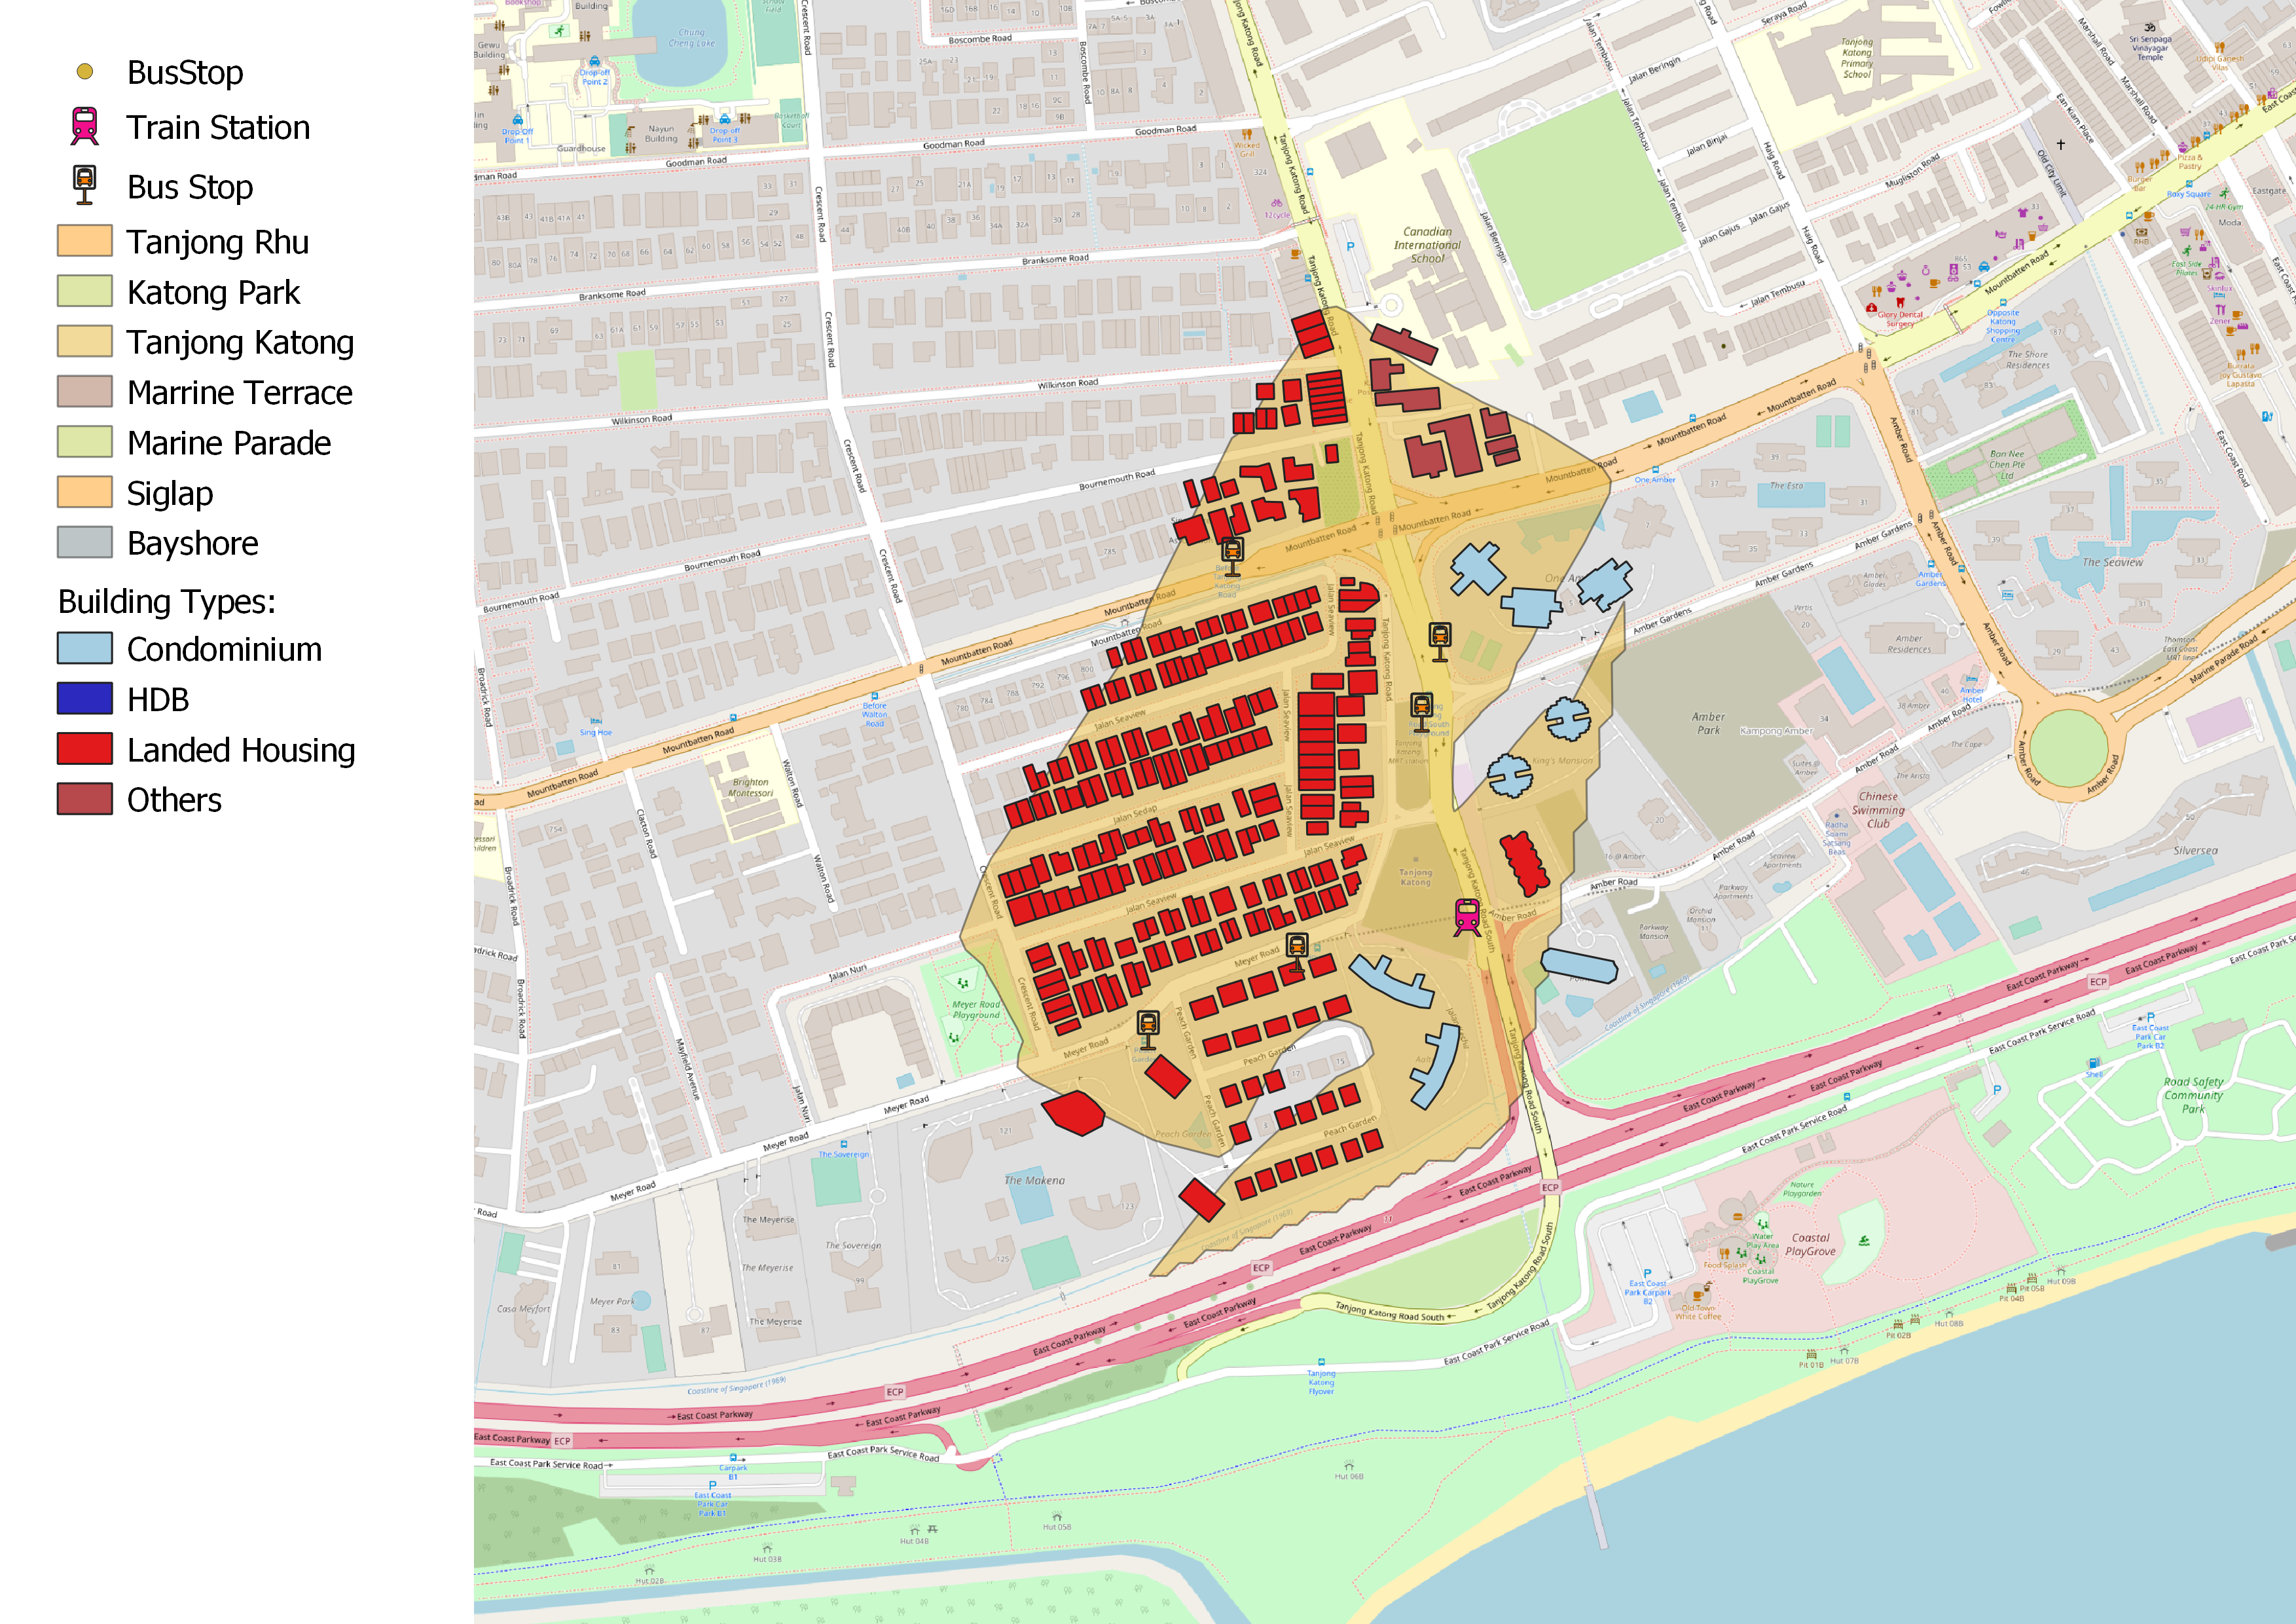
TE25 Tanjong Katong Station has the lowest population density of 0.021 among the seven TEL station.
Evidently, the majority of the residential buildings in this catchment area are landed housing which have relatively fewer people staying in compared to condominiums and HDBs.
In other words, this train station does not serve a significant amount of residents within a 500m shortest path distance.
TE26 Marine Parade Station
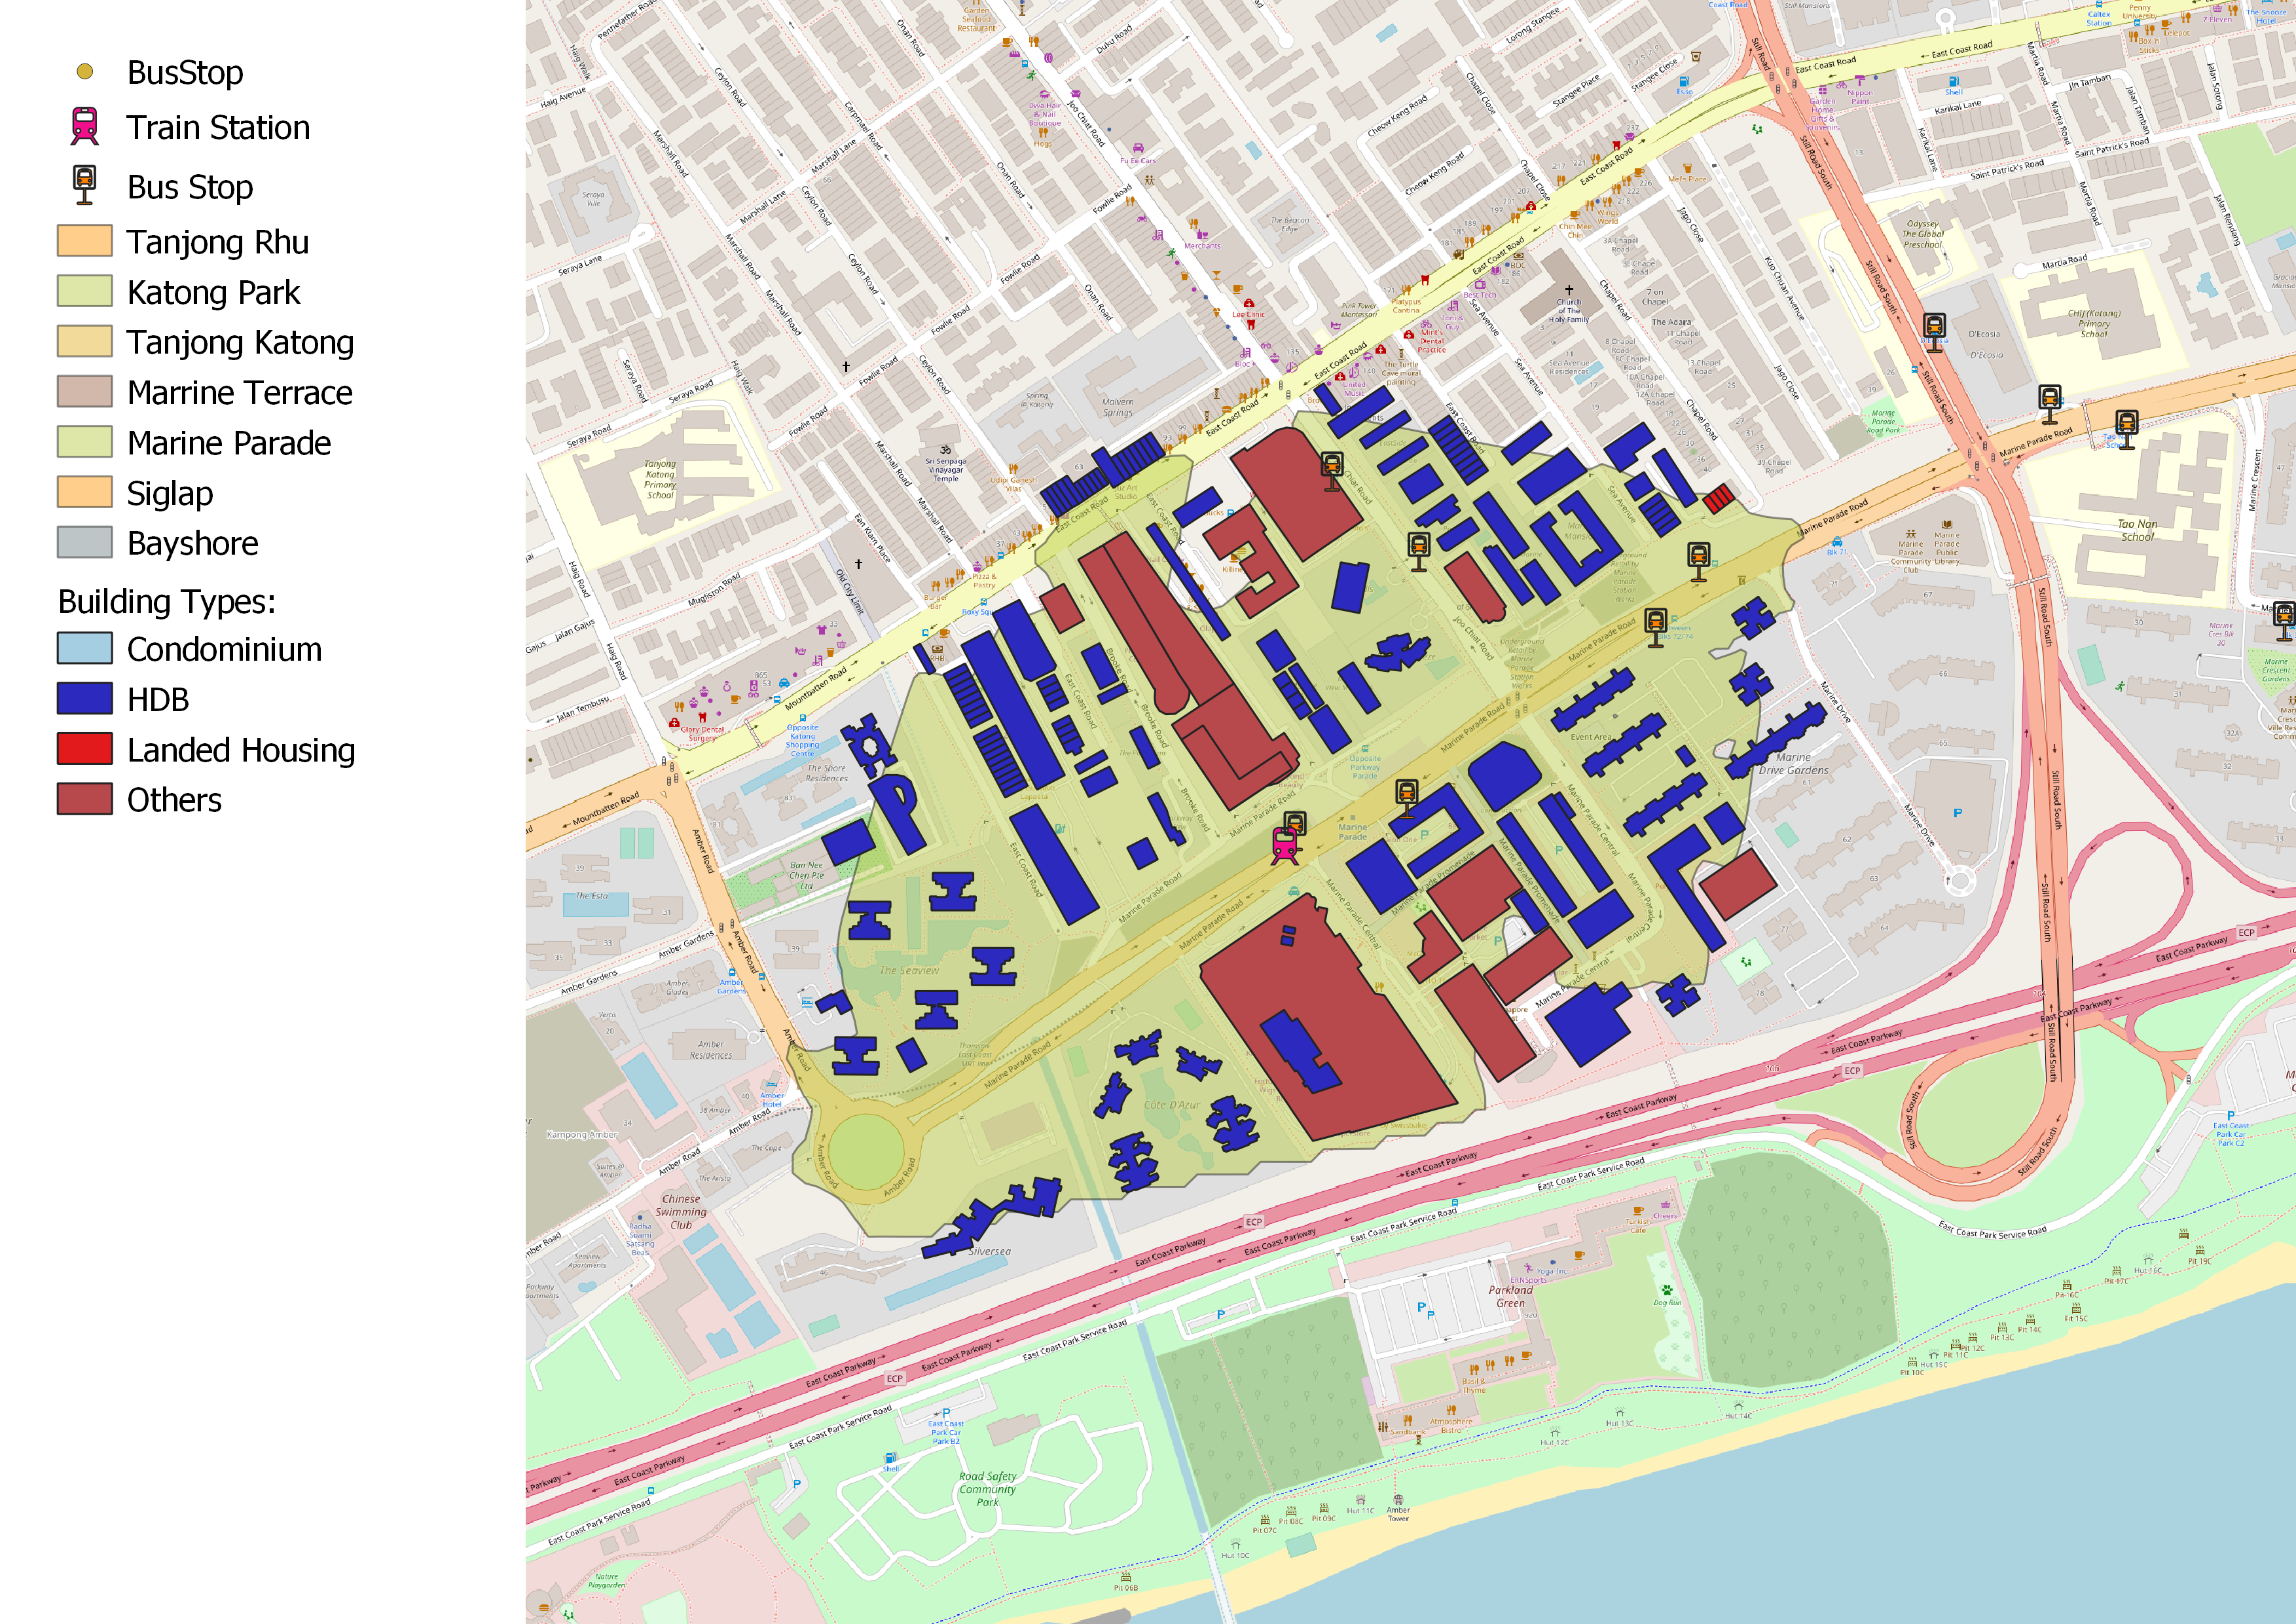
TE26 has the highest population density value of 0.247 - the second highest among the seven TEL train stations. This could be explained by the numerous HDBs located in the catchment area.
TE27 Marine Terrace Station
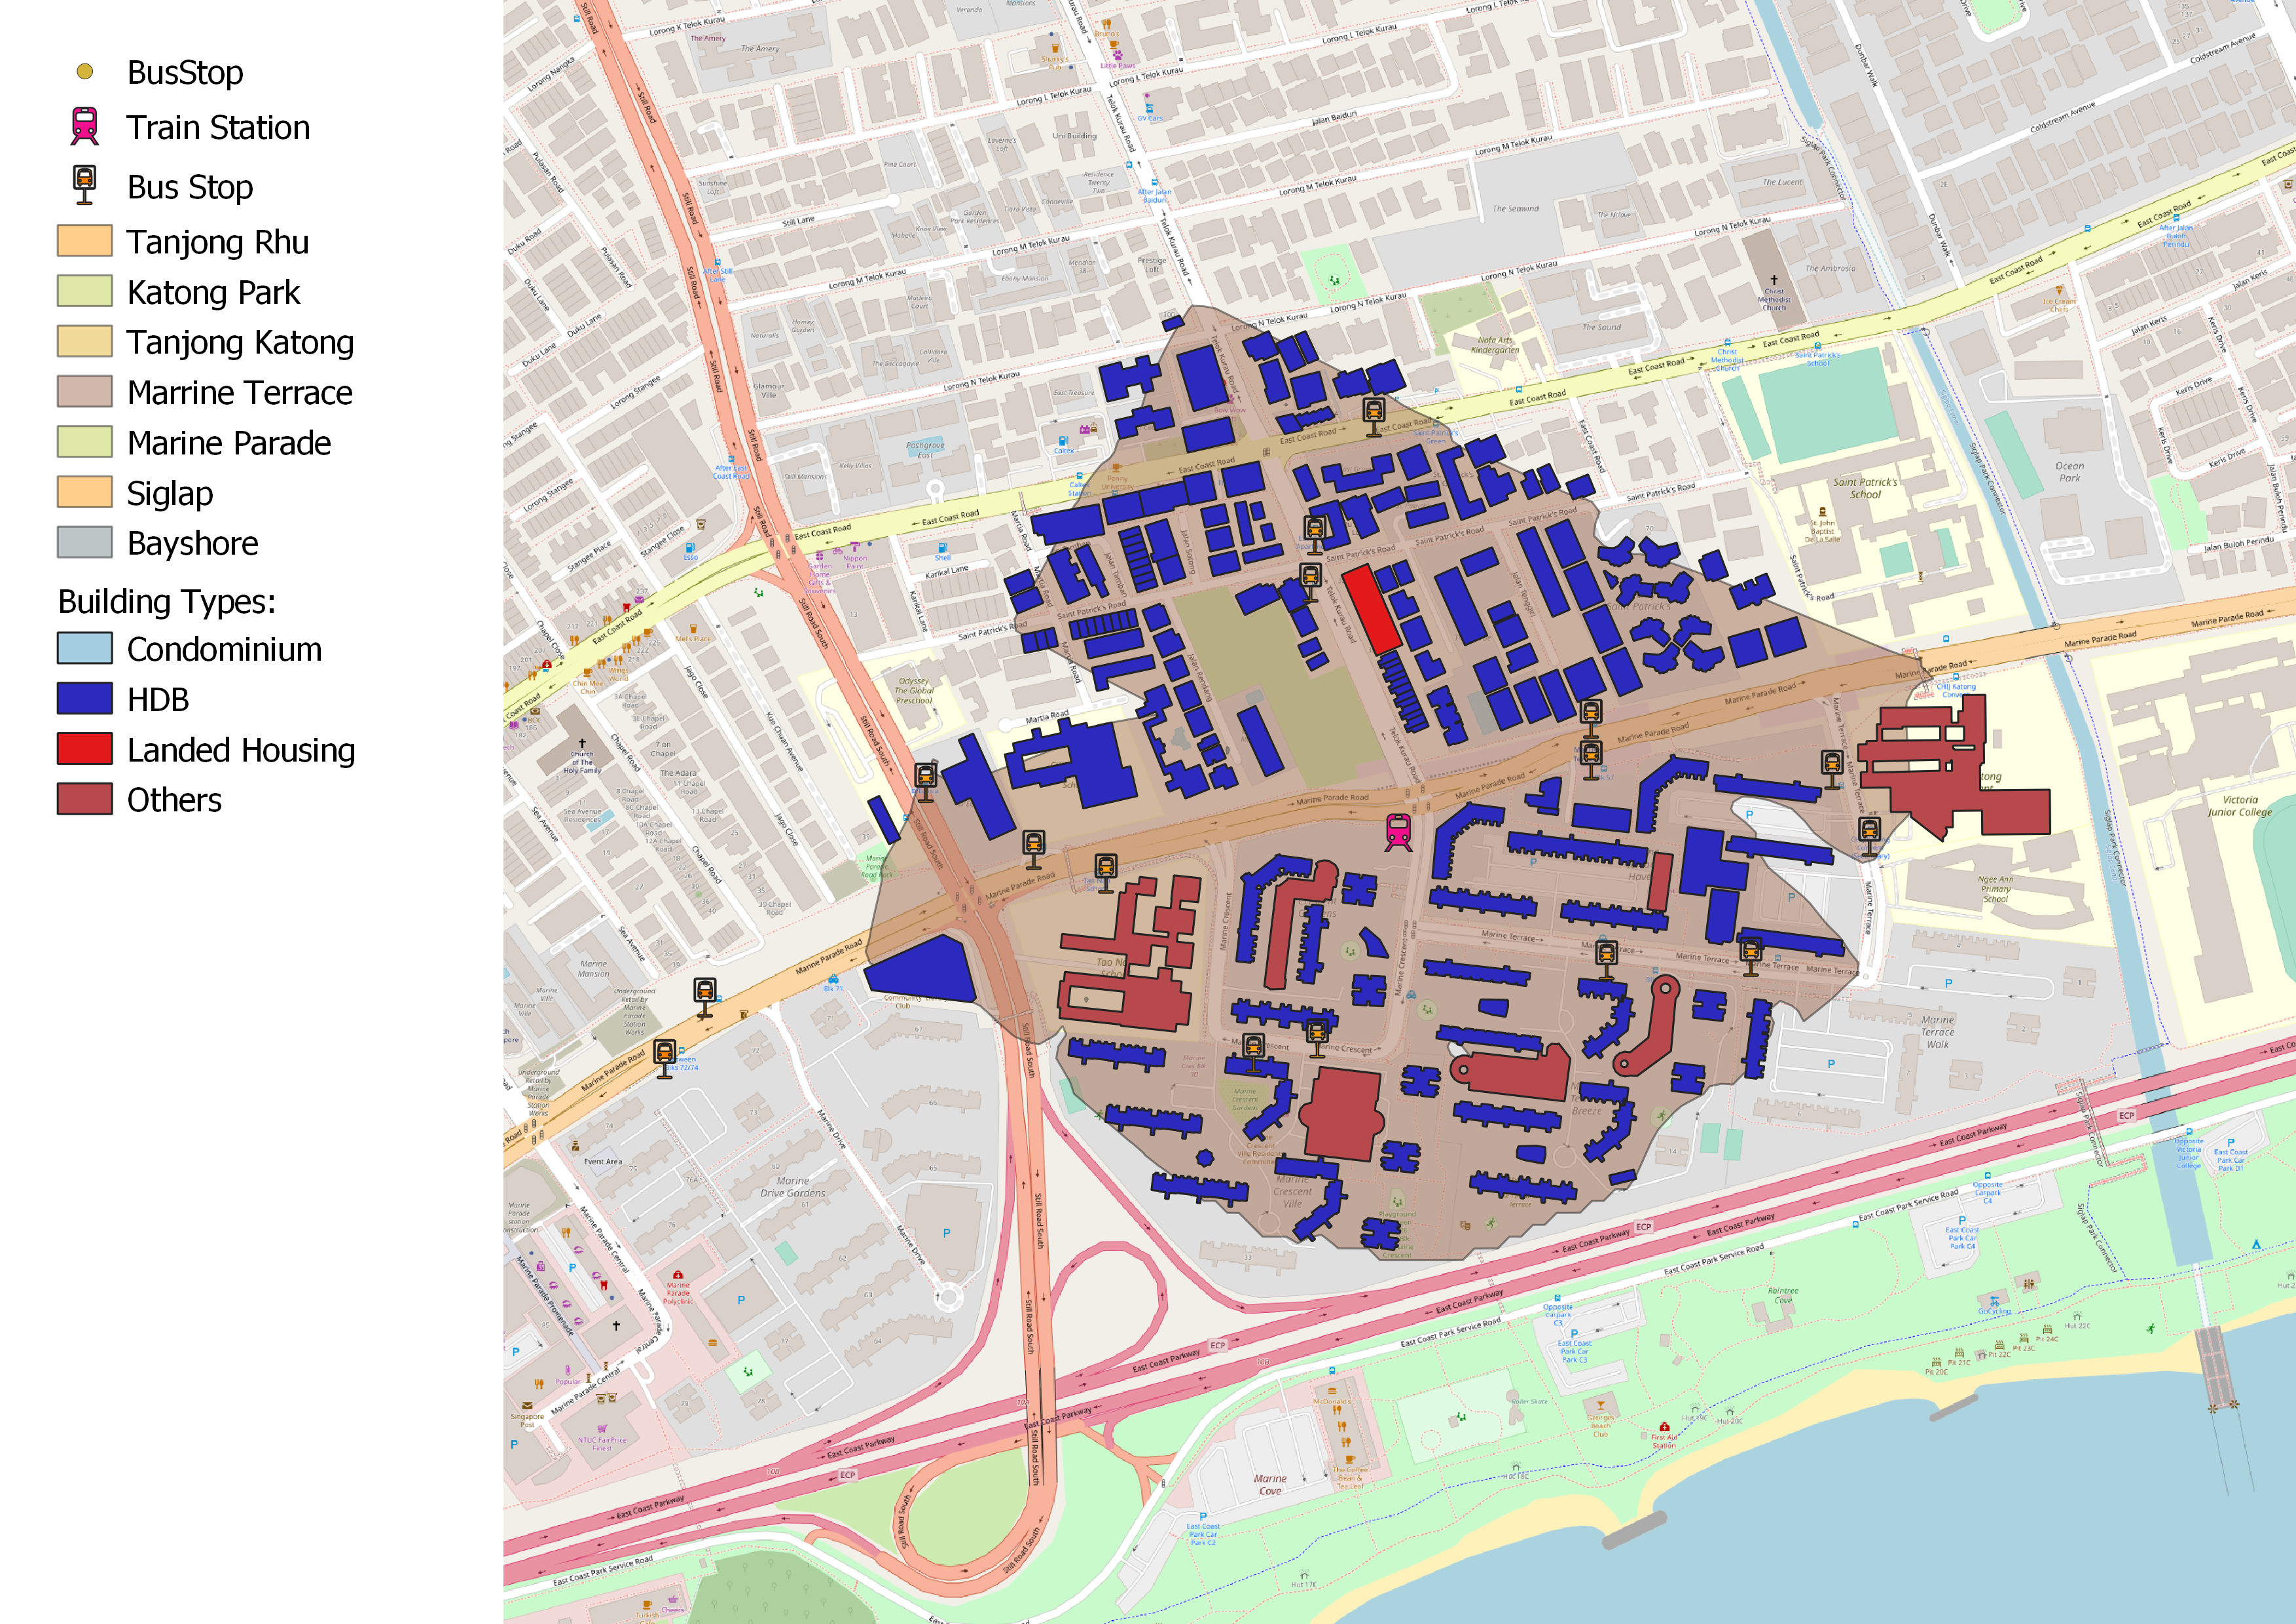
TE27 has the highest population density value of 0.243 - the highest among the seven TEL train stations.
Based on our analysis, we can observe that the majority of residential buildings in the catchment area are HDBs. This could explain the high population density value due the clustering of high-rise residential buildings where more people live in.
TE28 Siglap Station
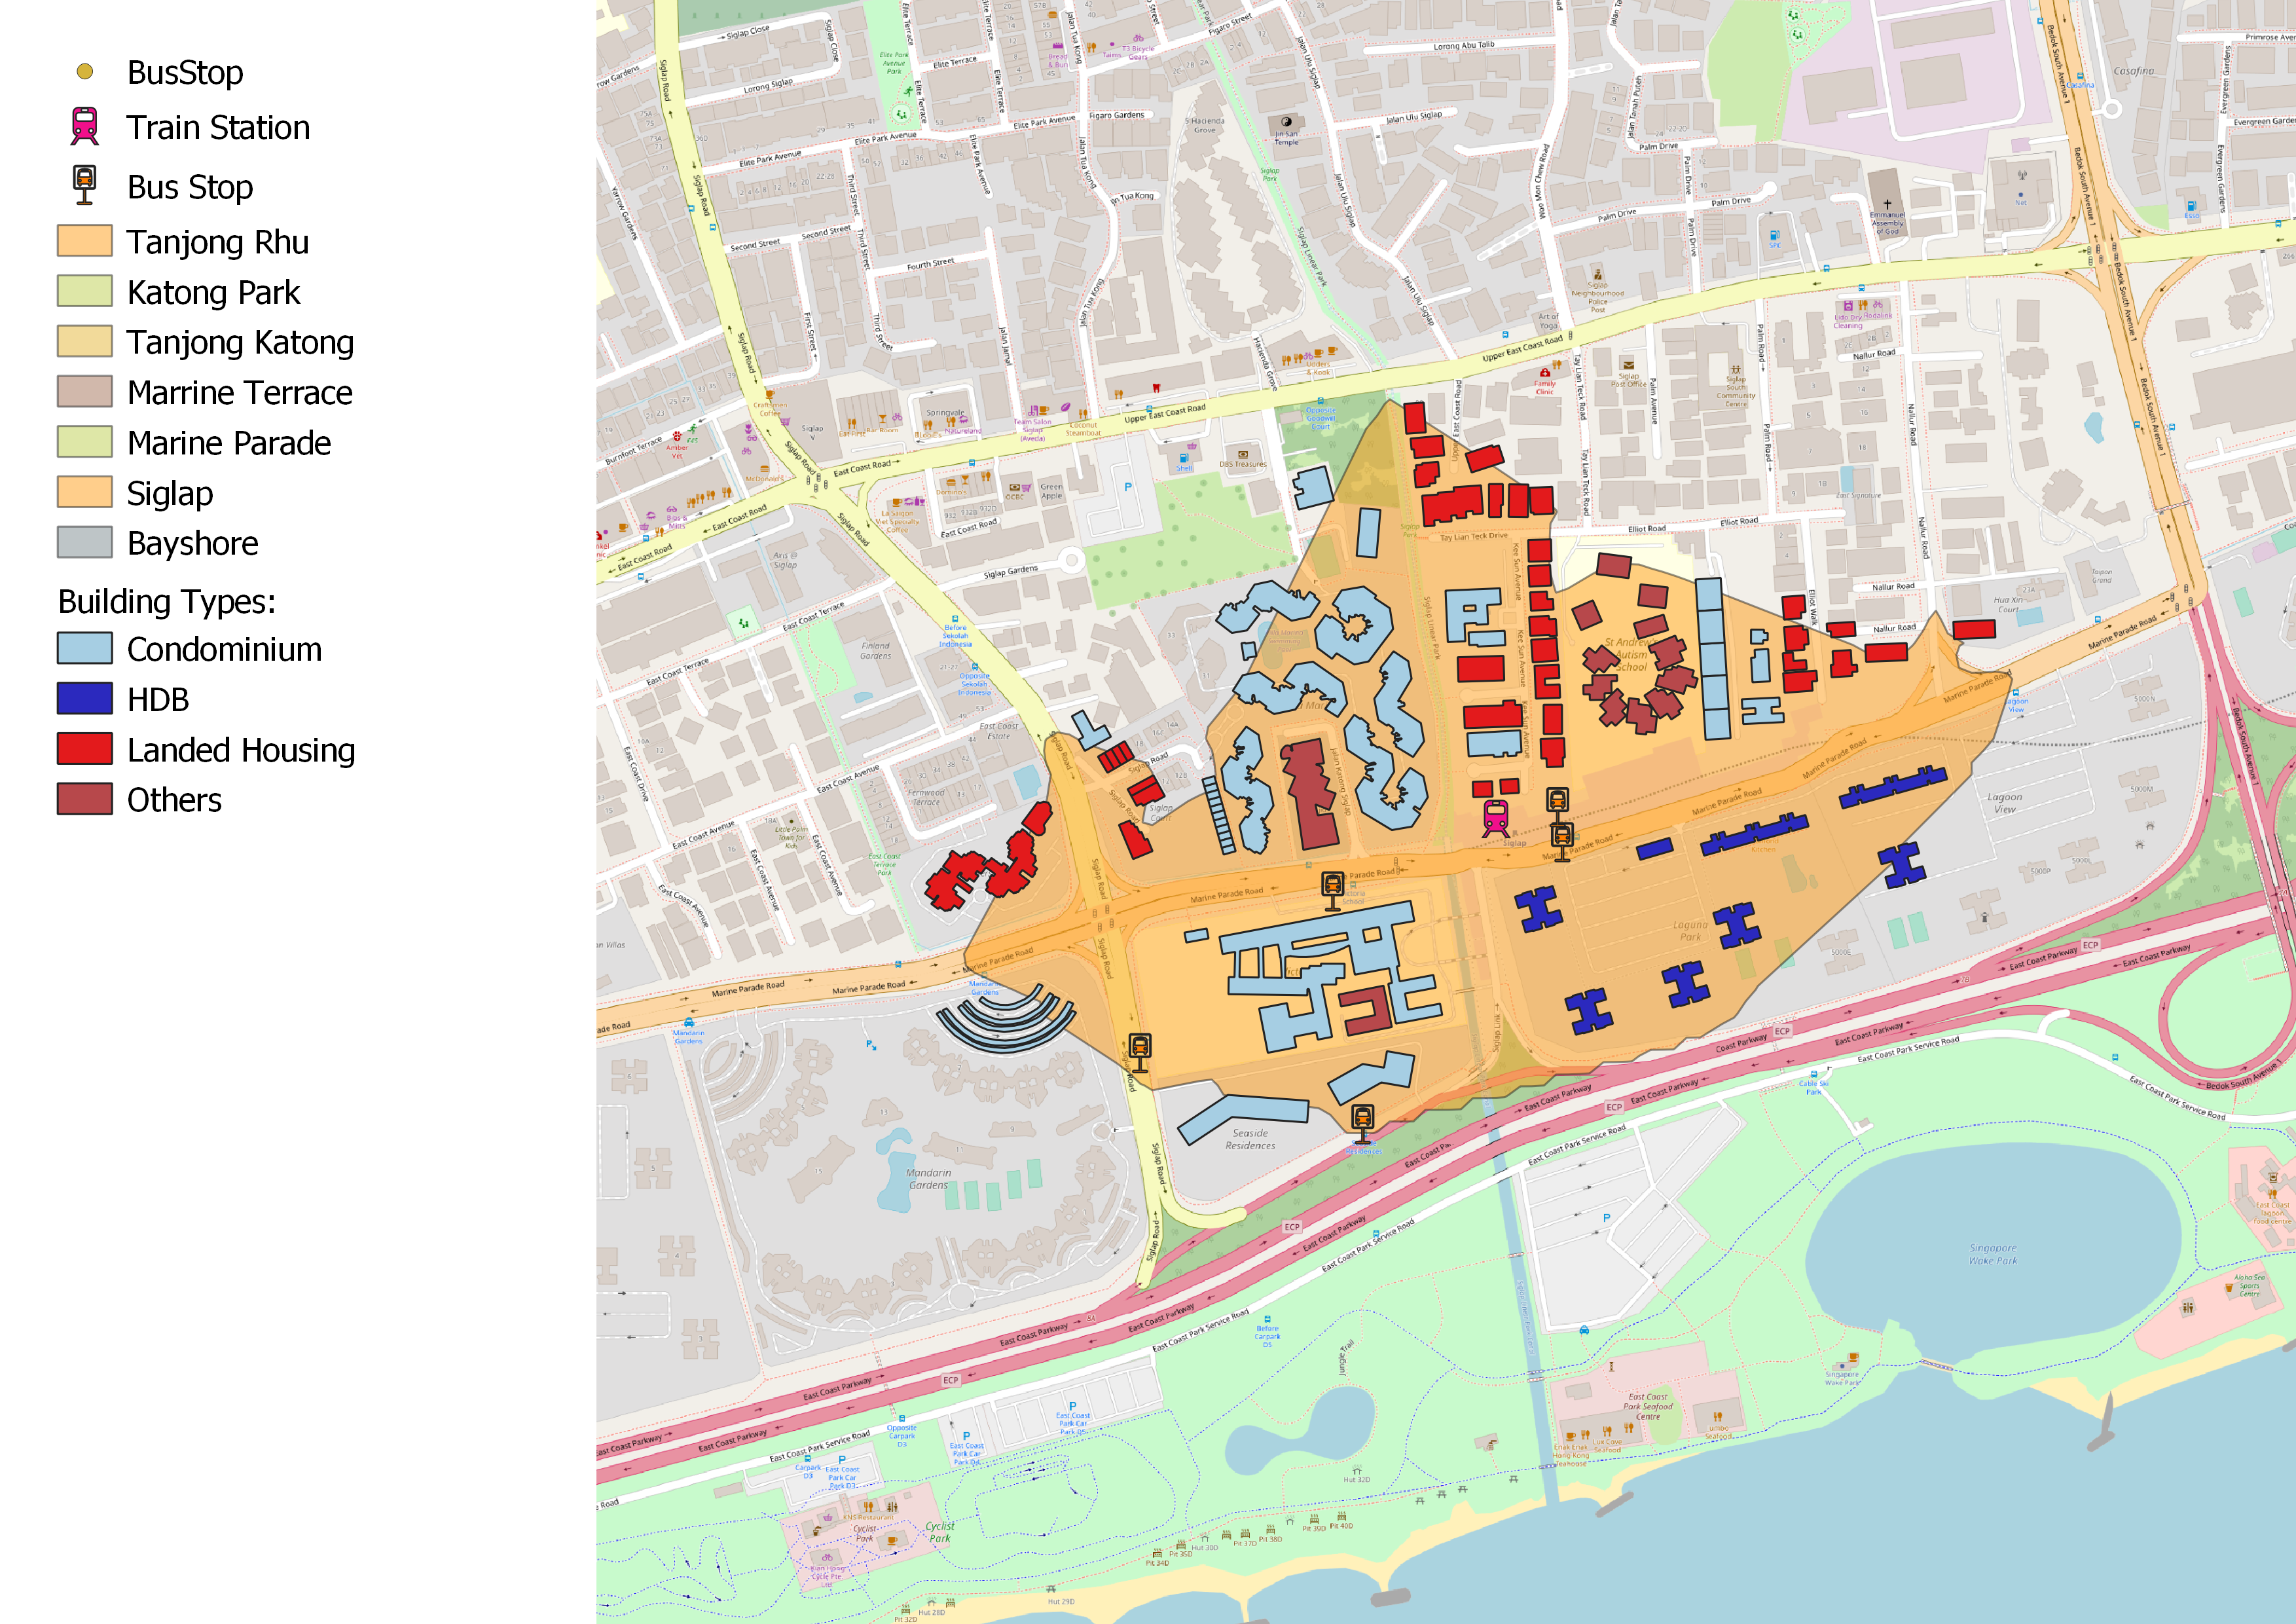
Based on our analysis, we can observe that most of the residential buildings located in the catchment area are either condominiums or landed housing. Moreover, there are relatively few residential buildings in this catchment area.
TE29 Bayshore Station
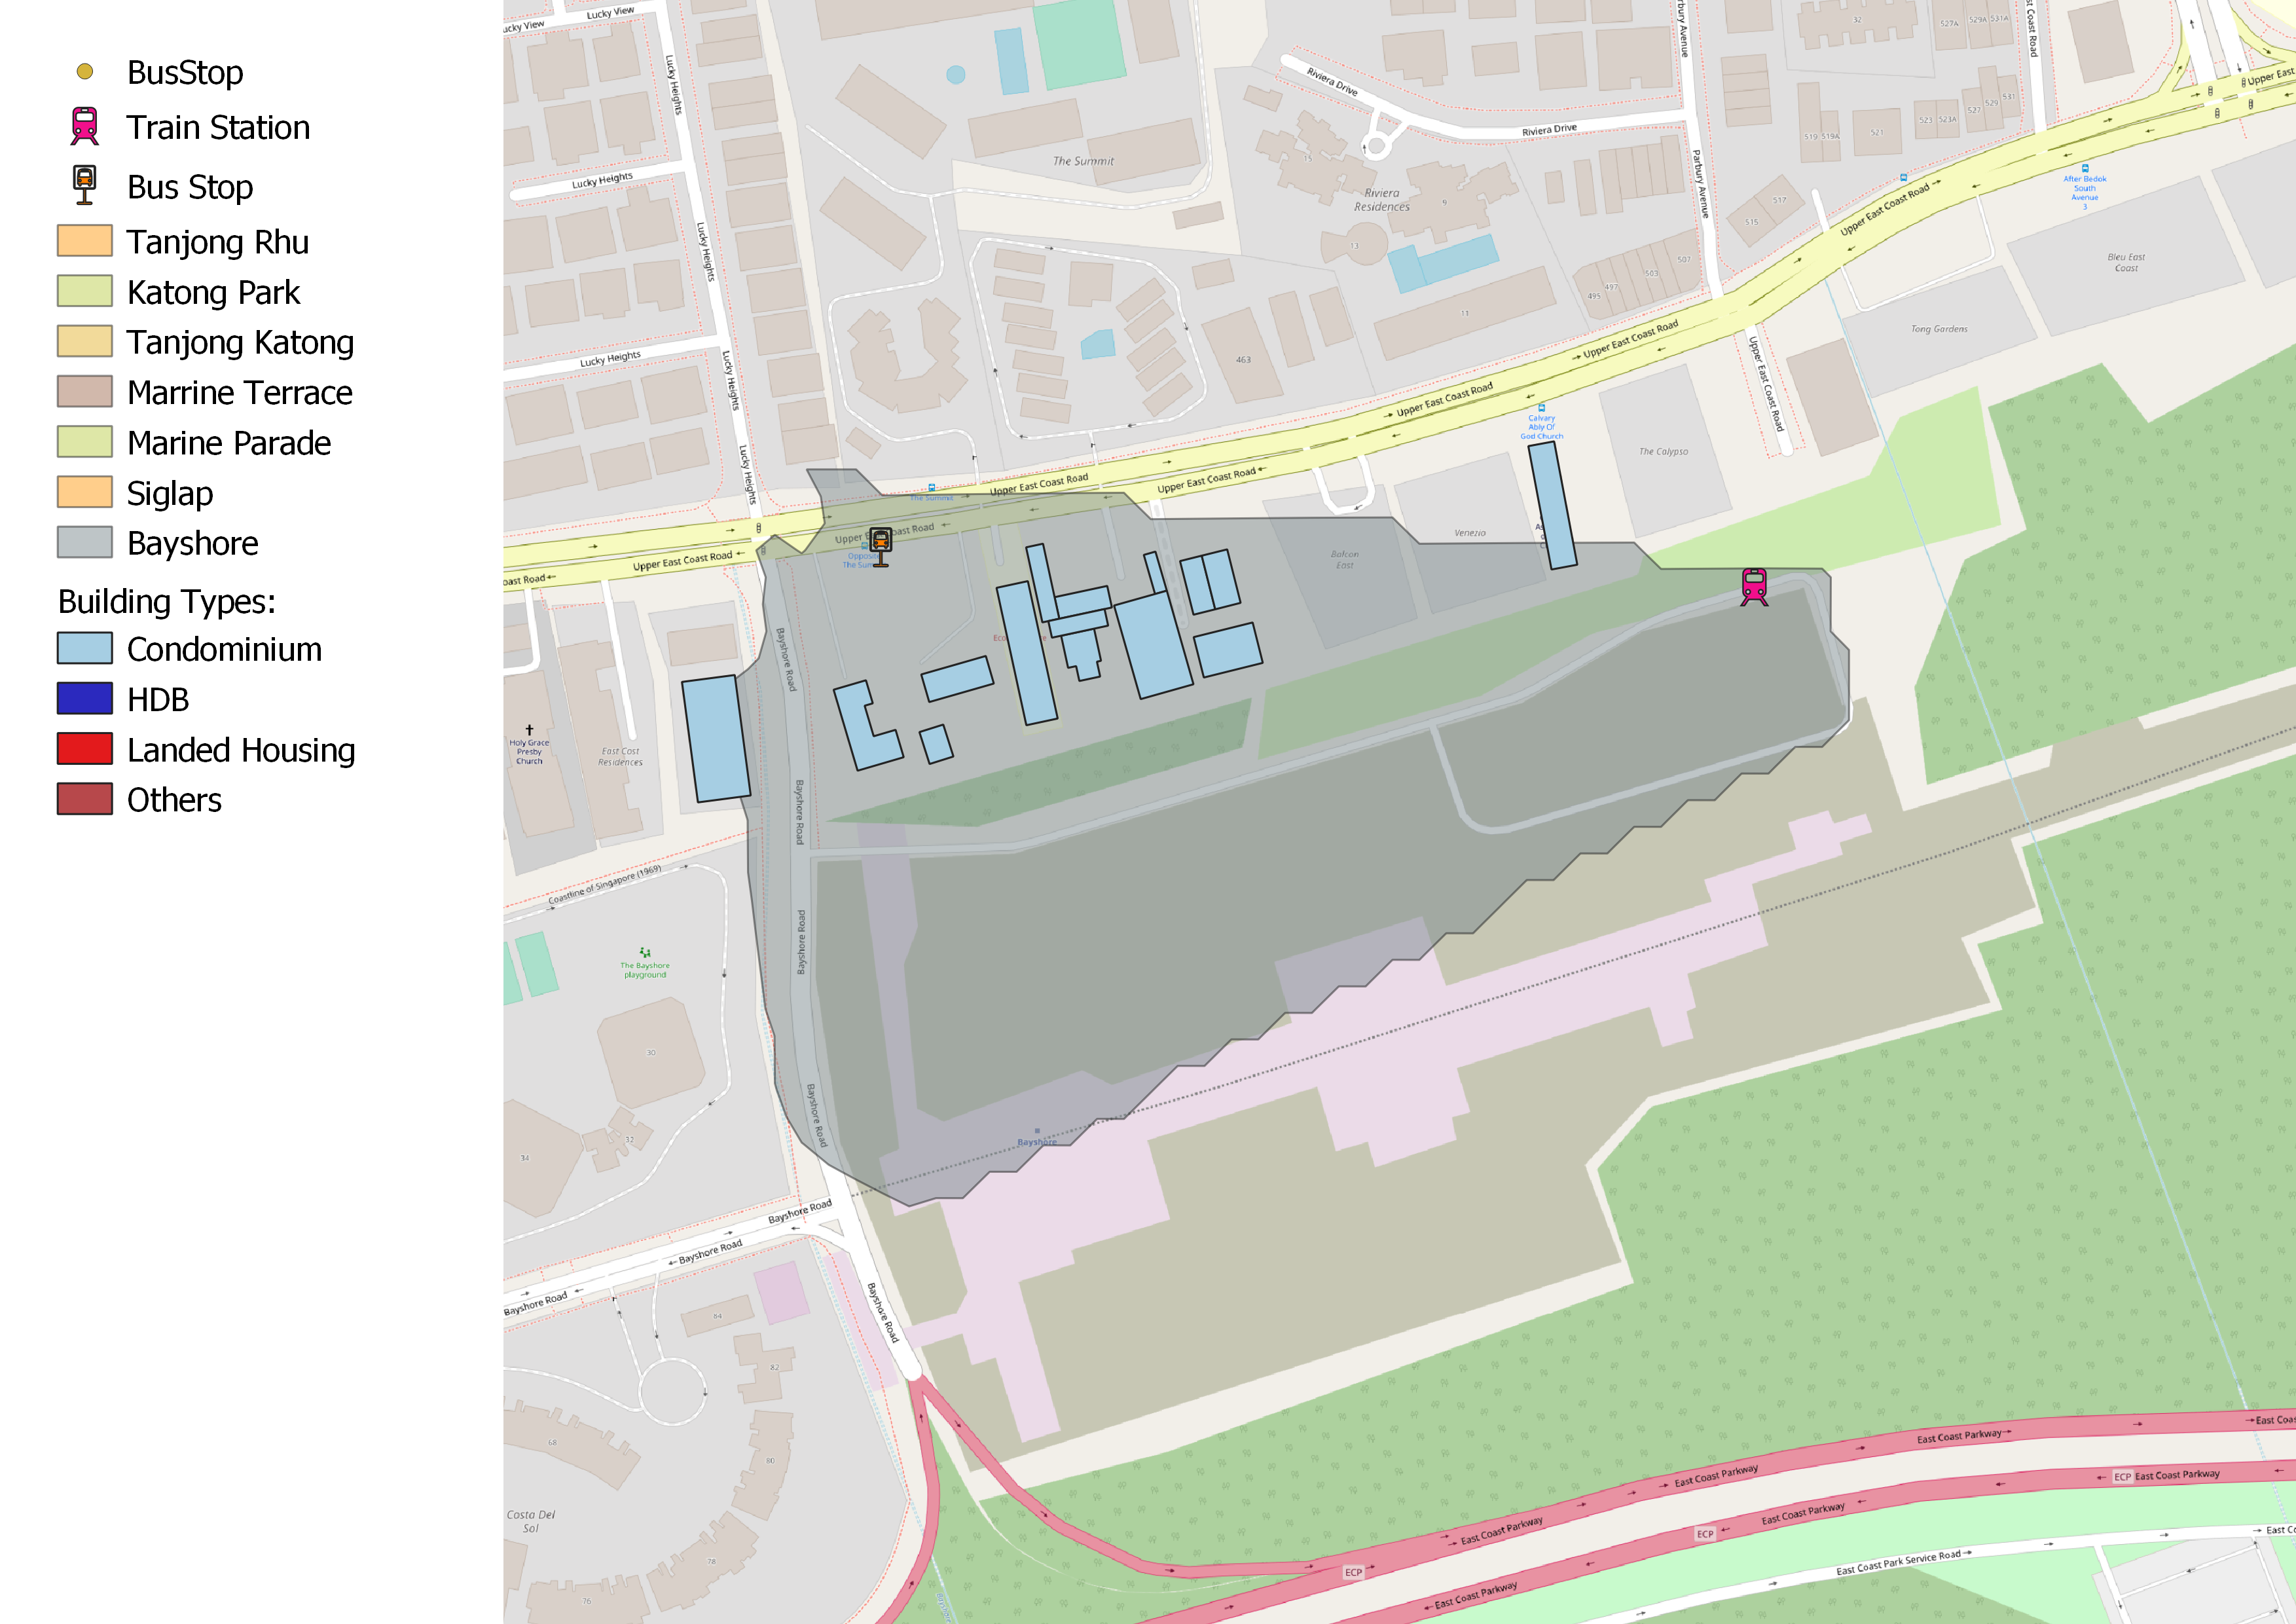
From our analysis and research, we can tell that TE29 Bayshore station is situated near forested area which limits the catchment area of the train station.
Furthermore, there are relatively few residential buildings located in its catchment area. The residential buildings located in the catchment are namely condominiums.
Population Density
| TEL Station | Estimated Population | Catchment Area Size | Population Density (sqmi) |
|---|---|---|---|
| TE23 Tanjong Rhu | 15,200 | 170,145 | 0.089 |
| TE24 Katong Park | 35,200 | 451,532 | 0.078 |
| TE25 Tanjong Katong | 4,688 | 225,622 | 0.021 |
| TE26 Marine Parade | 86,424 | 355,086 | 0.243 |
| TE27 Marine Terrace | 110,086 | 446,285 | 0.247 |
| TE28 Siglap | 21,342 | 301,009 | 0.071 |
| TE29 Bayshore | 6,000 | 76,360 | 0.079 |
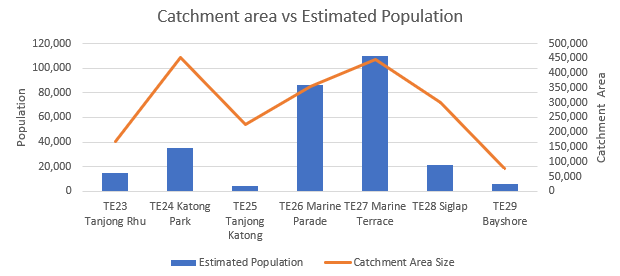
Based on our graph and data, not all train stations serve an equal distribution of residential population. Additionally, the catchment area of certain train stations are inverse of the size of the population staying within the catchment area.
Average Population Density
\[ \frac{0.089 + 0.078 + 0.021 + 0.243 + 0.247+0.071+0.079} {7} = 0.11828 \]
Number of Nearby Bus Stops
These are the bus stops that fall within the catchment area of the respective TEL station.
| TEL Station | Number of Bus Stops in the Catchment |
|---|---|
| TE23 Tanjong Rhu | 6 |
| TE24 Katong Park | 7 |
| TE25 Tanjong Katong | 5 |
| TE26 Marine Parade | 6 |
| TE27 Marine Terrace | 14 |
| TE28 Siglap | 5 |
| TE29 Bayshore | 1 |
Discussion
Based on the population density calculated for all the train stations, we can observe that the majority of the train stations are situated in areas either with significant landed housing or areas with low high-rise residential buildings (HDBs/condominiums).
That being said, TE27 Marine Terrace and TE26 Marine Parade have the highest and second highest population density respectively. It can be observed that these train stations are situated in areas with significant number of high-rise residential building.
From our analysis, we can tell that stations such as TE23 Tanjong Rhu and TE29 Bayshore are awkwardly situated which reduces their catchment area. The former is located between a river and an expressway, while the latter is located near forested area. In other words, the location of these train stations could have been better considered.
Instead of building a train station, the government could have considered enhancing the current bus network as some of these areas have existing bus stops. At the end of the day, there has to be sufficient justification to spend millions of dollars of taxpayers’ money to build these train stations.
Conclusion
In conclusion, TEL Stage 4 stations will not serve as many commuters, as they are not positioned in densely populated areas. This is due to the fact that within 500 meters of the stations, majority of the residential areas are for private residences. Thus, TEL Stage 4 stations will serve fewer people, compared to other train stations situated among HDB flats/heartlands.
On the bright side, we believe that TEL Stage 4 will increase MRT accessibility for residents living near East Coast Park; can utilize the TEL over the EWL. The availability of nearby bus stops enhances the public transport network for residents.
Future Analysis and Limitations
Based on the URA master plan, certain districts along the TEL Stage 4 lines such as Bayshore and Tanjong Rhu are still undergoing further development of their land use for both residential and community open areas such as recreational parks and community centers. Additionally, this analysis does not take into account office work spaces and schools as we are only analyzing residential areas. Hence, we believe that as those areas continue to develop, the different stations might suite the needs of different types of people.